Phylogeny
Phylogeny is the study of organismal descent and shows how they change over time. The trees below show different methods of determining the phylogeny of organisms. Heavily influenced by the theory of evolution, each tree shows a potential line of descent these organisms had from a single organism.
Phylogeny is the study of organismal descent and shows how they change over time. The trees below show different methods of determining the phylogeny of organisms. Heavily influenced by the theory of evolution, each tree shows a potential line of descent these organisms had from a single organism.
Figure 1: Phylogenetic tree example (1)
|
How do you interpret a phylogenetic tree?
The following terms describe each part of a phylogenetic tree: 1. Roots represent the common ancestor for all organisms in the tree. 2. Nodes represent a common ancestor between more than one species. 3. Branches show the genetic relationships between the organisms on the tree. Branch Length shows the relative age of a species, the longer the branch length, the longer it has existed compared to other species in the tree. 4. Clades represent a group of organisms sharing a common immediate ancestor (1). |
What is the phylogeny of PTPN11?
The following trees were generated using the JALVIEW program within ClustalOmega. Neighbor joined trees are created via a "bottum-up" method based on DNA sequence data that minimizes branch lengths. Trees generated using average distance have branches at an average distance from each other. If constructed by percent identity, the tree distances are based on the percentage differences of the DNA sequence of each organism. If constructed by BLOSUM matrix, that indicates that the tree distances are based on amino acid similarities with some amino acid similarities having a larger effect than others (2).
The following trees were generated using the JALVIEW program within ClustalOmega. Neighbor joined trees are created via a "bottum-up" method based on DNA sequence data that minimizes branch lengths. Trees generated using average distance have branches at an average distance from each other. If constructed by percent identity, the tree distances are based on the percentage differences of the DNA sequence of each organism. If constructed by BLOSUM matrix, that indicates that the tree distances are based on amino acid similarities with some amino acid similarities having a larger effect than others (2).
|
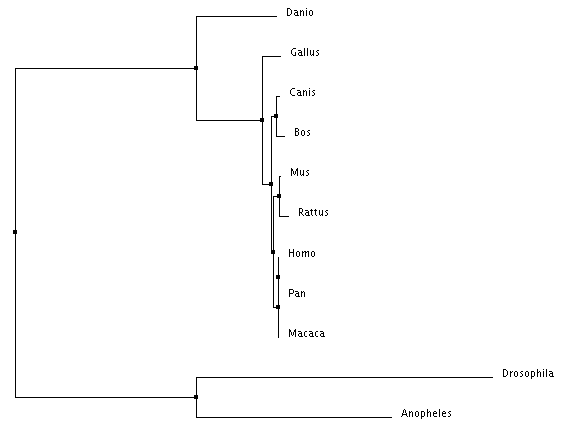
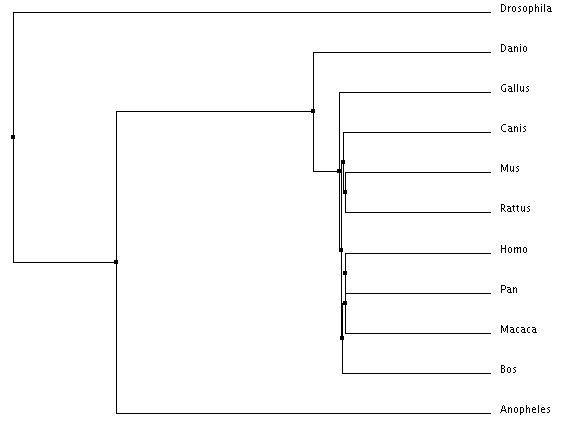
Figure 2: Neighbor joining by percent identity
|
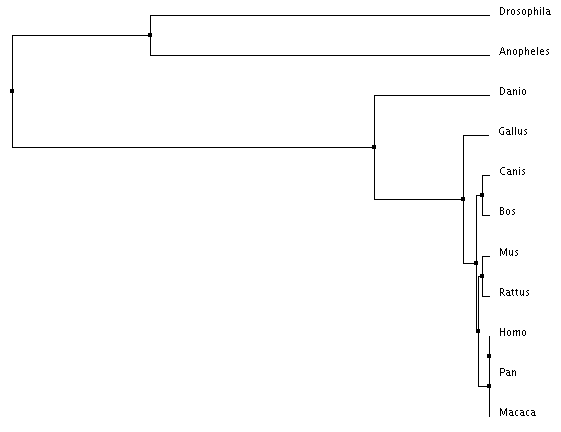
Figure 3: Average distance by percent identity
|
|
|
|
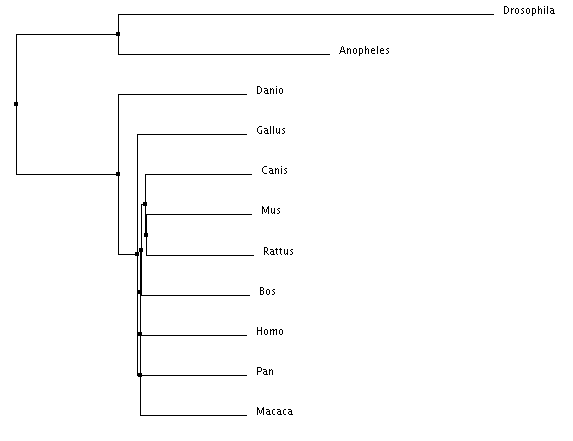
Figure 4: Neighbor joining by BLOSUM matrix
|
Figure 5: Average distance by BLOSUM matrix
|
|
|
Phylogenetic Analysis
There are important similarities and distinctions between each tree type. For example, every tree places Homo sapiens, Pan troglodytes, and Macaca mulatta within the same clade (share the same immediate ancestor). This is expected due their identical PTPN11 DNA sequences. However, in Figure 5, Anopheles (mosquito) is shown outside of a clade with Drosophila despite them being both insects. Due to the mathematic nature of the generation of these trees it is possible for placements to be incorrect. Figures 2-4 depicting the two insects being within the same clade are most likely the more accurate trees.
There are important similarities and distinctions between each tree type. For example, every tree places Homo sapiens, Pan troglodytes, and Macaca mulatta within the same clade (share the same immediate ancestor). This is expected due their identical PTPN11 DNA sequences. However, in Figure 5, Anopheles (mosquito) is shown outside of a clade with Drosophila despite them being both insects. Due to the mathematic nature of the generation of these trees it is possible for placements to be incorrect. Figures 2-4 depicting the two insects being within the same clade are most likely the more accurate trees.
